Food comparison
Cooked rice vs quinoa
Compare cooked white rice and cooked quinoa. Check the source descriptions and use your own weights in the interactive food calculators.
Per 100 g, Rice, white, cooked contains 28.2 g of total carbohydrate, compared with 21.3 g in Quinoa, cooked. These values describe the specific USDA records linked below, including each food’s preparation.
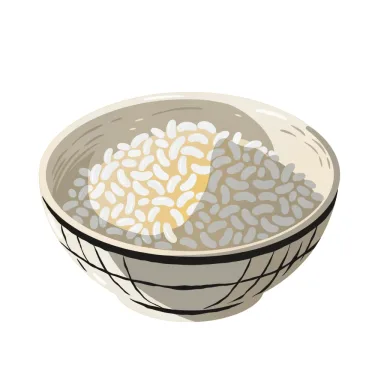
Rice, white, cooked
28.2 g carbs / 100 g
Adjust your portion →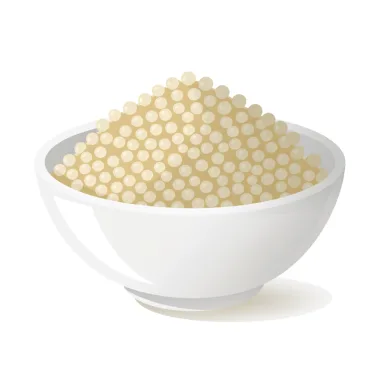
Quinoa, cooked
21.3 g carbs / 100 g
Adjust your portion →The same weight
| Per 100 g | Rice, white, cooked | Quinoa, cooked |
|---|---|---|
| Total carbohydrate (g) | 28.2 | 21.3 |
| Dietary fiber (g) | 0.4 | 2.8 |
| Total sugars (g) | <0.1 | 0.9 |
| Protein (g) | 2.7 | 4.4 |
| Total fat (g) | 0.3 | 1.9 |
| Energy (kcal) | 130 | 120 |
The reference portions
These amounts can have different weights. They are source measurements, not recommended servings.
- Rice, white, cooked: 1 cup (158 g) contains 44.6 g of carbohydrate.
- Quinoa, cooked: 1 cup (185 g) contains 39.4 g of carbohydrate.
How to use this comparison
The same-weight table compares nutrient concentrations. Your portion may be larger or smaller. Open either food’s calculator to calculate your actual amount, or use the interactive comparator for other foods. A lower carbohydrate value alone does not establish which food is best for you.
Sources
Rice, white, cooked — FDC 168878. SR Legacy, April 2018. Original description: Rice, white, long-grain, regular, enriched, cooked.
Quinoa, cooked — FDC 168917. SR Legacy, April 2018. Original description: Quinoa, cooked.
Computed directly from the source profiles in CarbTable. Imported October 26, 2026. Read the calculation rules.